CWA_Sunset_4k.jpeg
ClimateWatch App
Download the
CWA_Sunset_4k.jpeg
Slide Two
Slide Two
previous arrow
next arrow

BCCVL Species Distribution Models

ClimateWatch has worked with the Biodiversity and Climate Change Virtual Laboratory (BCCVL) in developing maps for the current, future and range-change predicted habitat suitability of over 100 terrestrial ClimateWatch indicator species.

Not all species monitored on the ClimateWatch program will have BCCVL species distribution models produced for them due to limited occurrence data and limited climate/environmental data for marine species.

CW BCCVL three maps

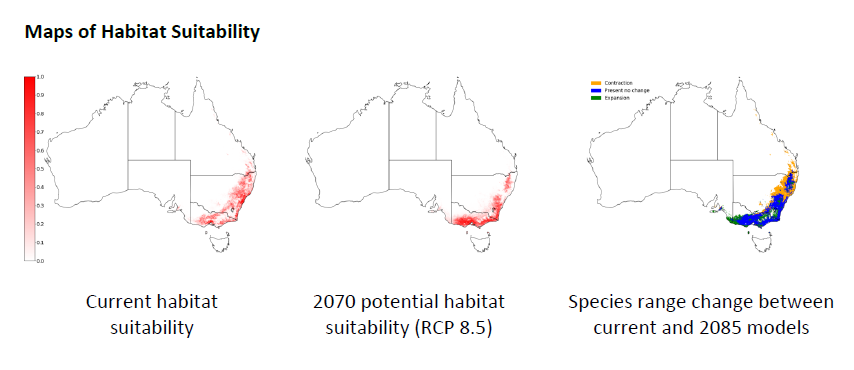
Above, the left and middle maps show the modelled habitat suitability for the species under current and potential future climate conditions. The colours indicate the predicted habitat suitability from low (white) to high (dark red). The future habitat suitability is modelled for the year 2070 under a climate change scenario that represents 'business as usual' (RCP 8.5). The map on the right shows how the range of the species might change between now and 2070, with orange areas indicating where the species might disappear, green areas where the species range might expand, and blue areas where the habitat is predicted to be suitable for the species now and in the future. The models for this species were run in the Biodiversity and Climate Change Virtual Laboratory. Please note that while models can be very informative, they are only a representation of the real world and thus should always be viewed with caution.

You can find the project summary report here.

You can read more about the science behind these models here.

CW BCCVL logo

The development of ClimateWatch Species Distribution Models was supported by the Inspiring Australia - Science Engagement Programme.

CW BCCVL maps IA logo

ClimateWatch smartphone app

Step 1: Citizen Science App Download

App Download

Download and install the free App on your Android device or on your iPhone via the App Stores linked below
Step 2: Register your SPOTTERON Citizen Science user account

Register

After starting the App, you can register your own user account on the platform with just your email address.
Step 3: Login and contribute in the Citizen Science App

Start!

Start observing! You are automatically logged-in after registering and you can add your first spot right away.


Download the App on your smartphone now or open the map in your browser:

 Badge App Download Android Badge App Download iPhone Open map

Latest Contributions

John Ruben
Date: 27.09.2024

Andofurness
Date: 26.09.2024

PeterReilly
Date: 26.09.2024

PeterReilly
Date: 26.09.2024

PeterReilly
Date: 26.09.2024

PeterReilly
Date: 26.09.2024

PeterReilly
Date: 26.09.2024

PeterReilly
Date: 26.09.2024

PeterReilly
Date: 26.09.2024

PeterReilly
Date: 26.09.2024


See more Spots on the map